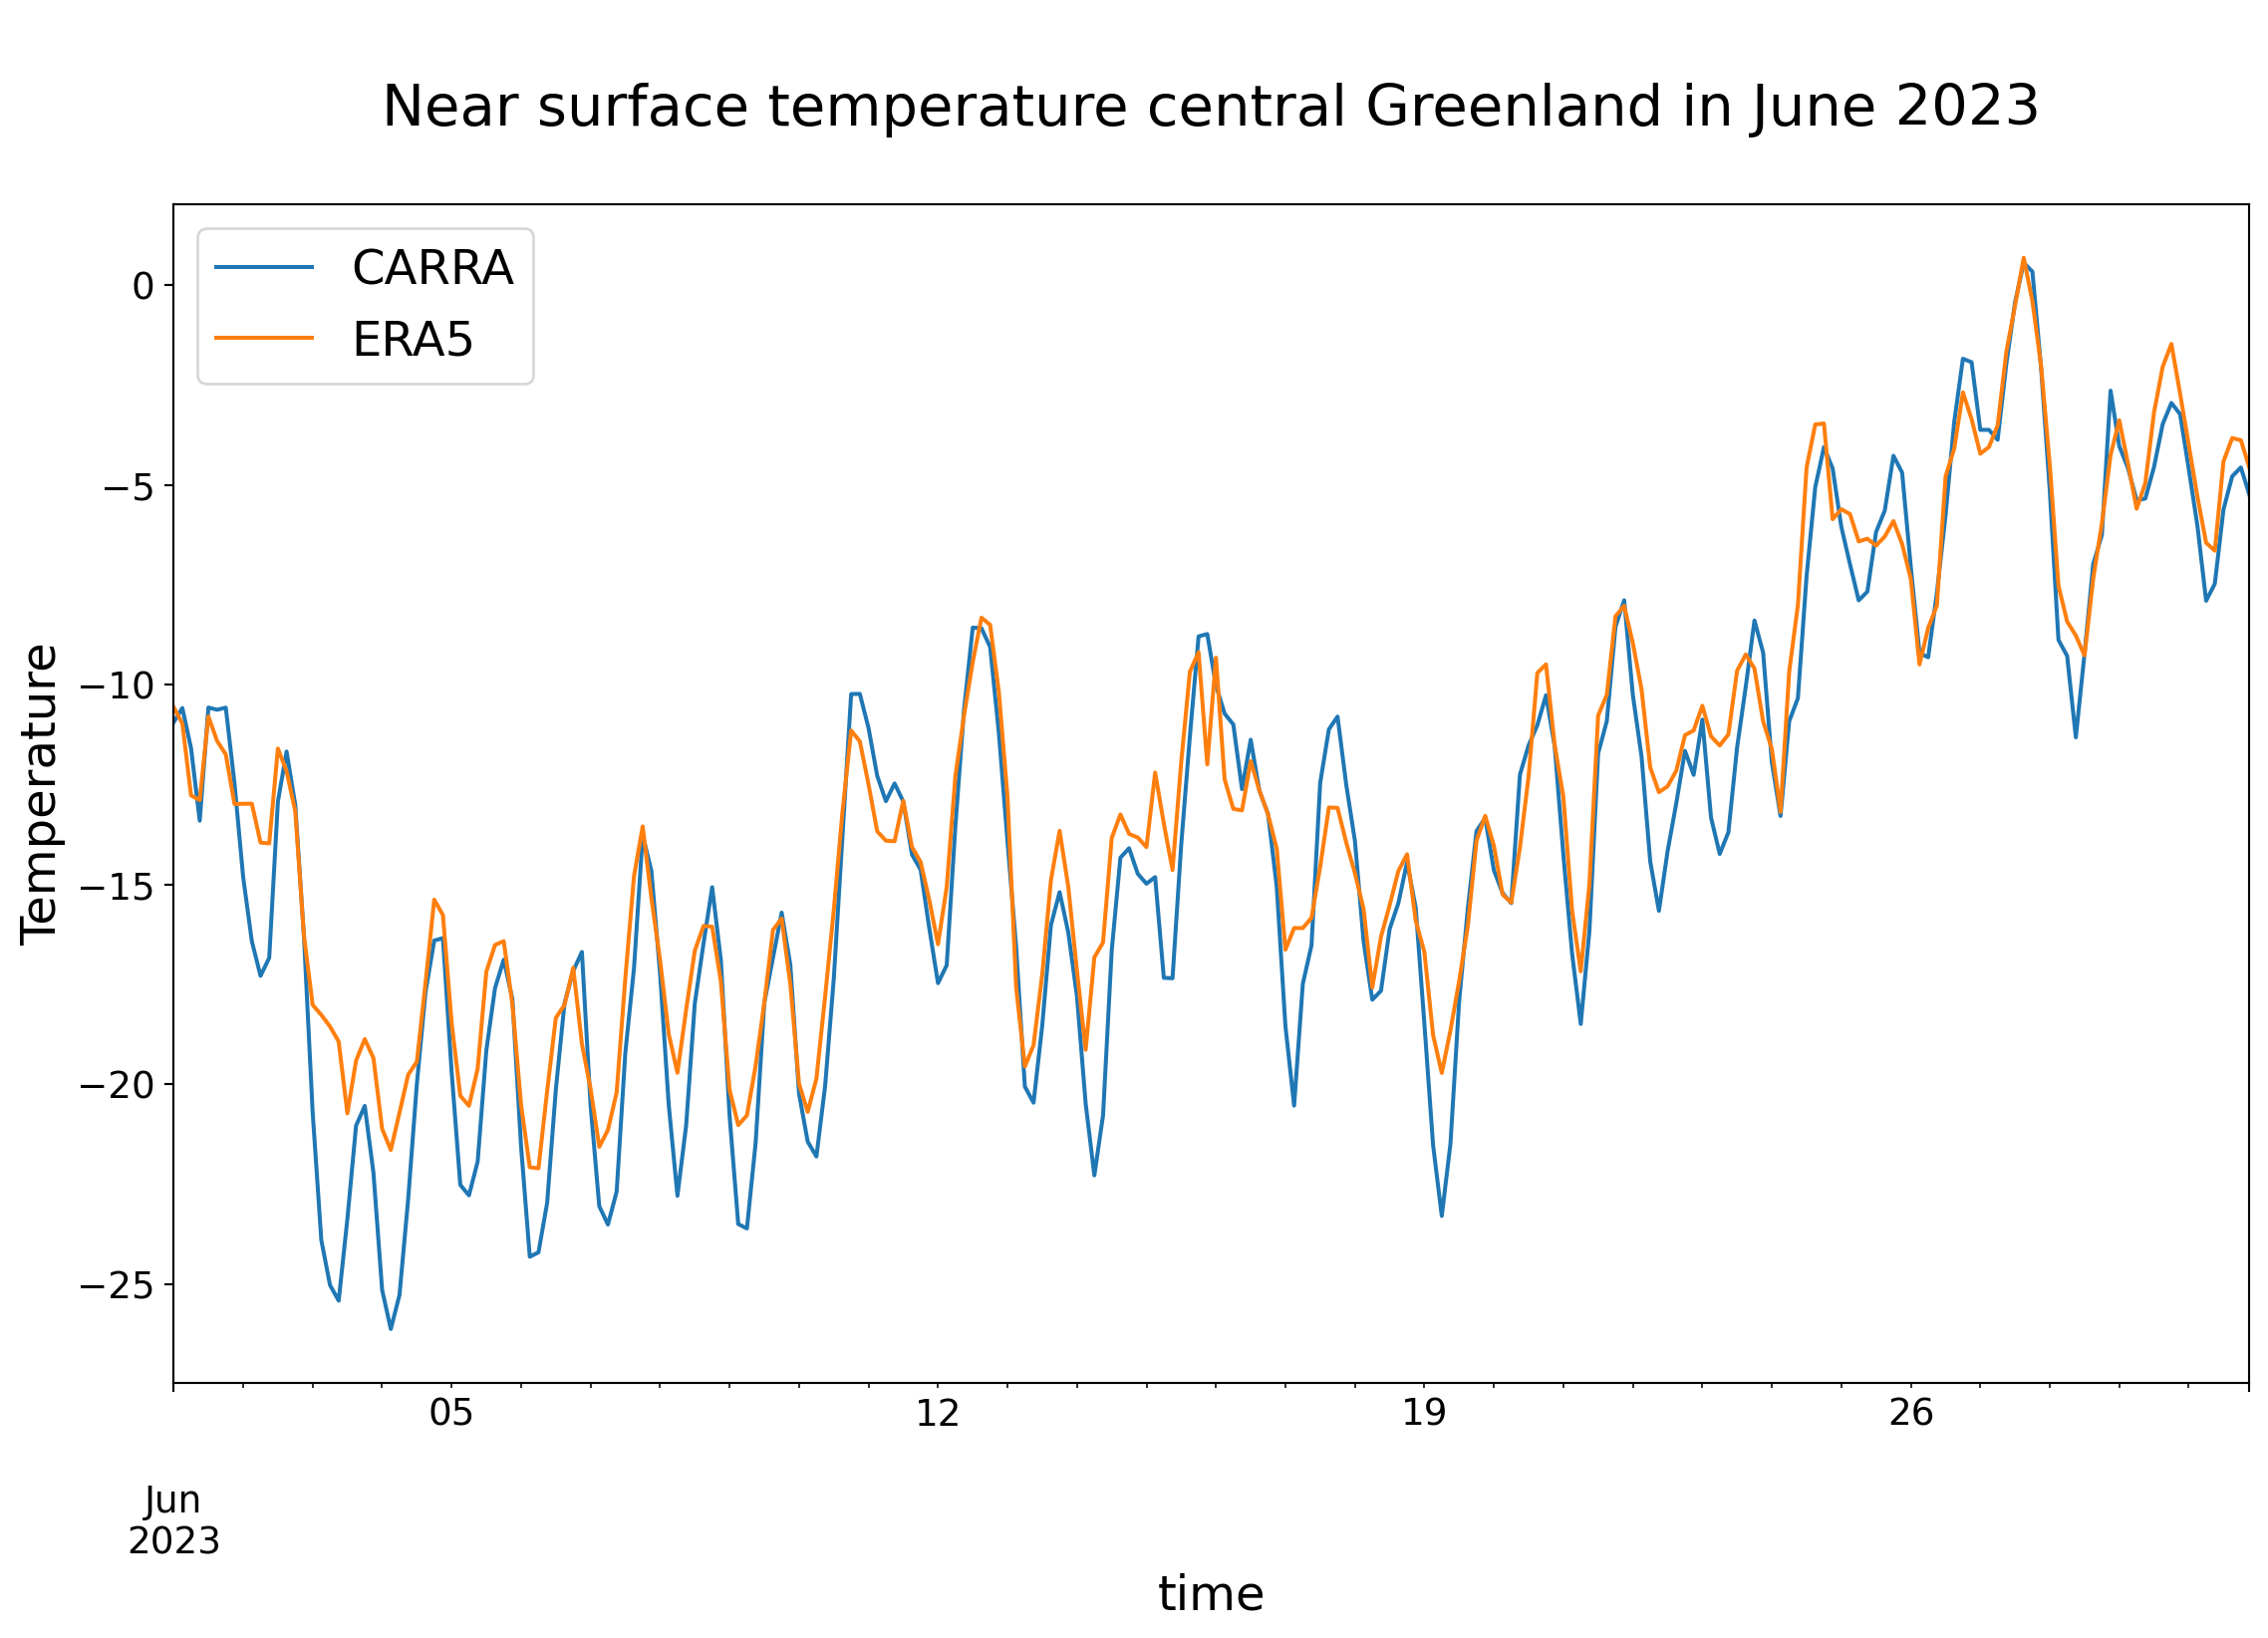
Here, plotting time series for a single grid cell.
Loading the data
Same procedure as in the earlier scripts.
import xarray as xr# Open DatasetsDATADIR ='/ec/res4/scratch/smos/CARRA'fCARRA =f'{DATADIR}/Raw_data/T2m_an_202306.grb'fERA5 =f'{DATADIR}/ERA5/era5_t2m_202306_CARRA_grid.nc'CARRA_ds = xr.open_dataset(fCARRA)CARRA_da = CARRA_ds['t2m']ERA5_ds = xr.open_dataset(fERA5)#ERA5_ds = ERA5_ds.assign_coords(longitude=CARRA_ds.longitude)ERA5_da = ERA5_ds['t2m']# Change unit from K to C and add the unit to the attributesERA5 = ERA5_da -273.15ERA5 = ERA5.assign_attrs(ERA5_da.attrs)ERA5.attrs['units'] ='deg C'CARRA = CARRA_da -273.15CARRA = CARRA.assign_attrs(CARRA_da.attrs)CARRA.attrs['units'] ='deg C'
Ignoring index file '/ec/res4/scratch/smos/CARRA/Raw_data/T2m_an_202306.grb.923a8.idx' older than GRIB file
Libraries for plotting and visualising data
import matplotlib.pyplot as pltimport pandas as pd
Pandas has functionalities which are beneficial here when plotting the time series. For instance, the metadata from the time axes is used automatically to describe the x-axis.
CARRA_df = p_CARRA.to_dataframe()CARRA_df = CARRA_df.rename(columns={'t2m':'CARRA'})ERA5_df = p_ERA5.to_dataframe()ERA5_df = ERA5_df.rename(columns={'t2m':'ERA5'})print("Start plotting time series")plt.rcParams.update({'font.size': 18}) # must set in topCARRA_df['CARRA'].plot( figsize=(14,8), fontsize=14, legend=['CARRA'], xlabel='\nday', ylabel='Temperature', title='\nNear surface temperature central Greenland in June 2023\n', )ERA5_df['ERA5'].plot( legend=['ERA5'], )plt.savefig(f'{DATADIR}/Figures/Central_Greenland_202306.png')